Without the proper tools, pinpointing the engine behind company growth — sales, marketing, or the two working in tandem — is an arduous task. In this article, we explore the value of the HubSpot reporting add on tool.
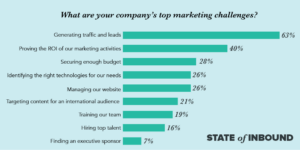
If this is you, you’re not alone. According to HubSpot’s “State of Inbound 2018” report, 40% of surveyed companies stated that their top marketing challenge was proving the ROI of marketing activities.
Similar issues come with sales. Which representatives are closing the greatest number of deals? Are cold emails working? If you’ve been there, then you’re at a point where in-depth reporting that closes the loop between marketing and sales is a must.
HubSpot comes with standard reporting capabilities, but to drill down to metrics unique to your business, you’re going to need HubSpot’s Reporting Dashboard Add-On on. Priced at $200/ month, it’s not an investment to be taken lightly.
With that price tag, is it worth it? Read on to find out what the tool offers, why it’s unique, and some potential drawbacks.
Features
So, what exactly is HubSpot’s Reporting Dashboard Add-On? It’s a tool for building customized reports in a way that’s organized and easy to understand. You can then syndicate your findings across your organization. Let’s break these components down:
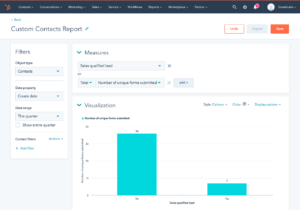
Building Customized Reports
With HubSpot’s Reporting Dashboard Add-On on, you can create a custom visual look at your data that answers virtually any sales or marketing related question. Want to know how many marketing qualified leads became sales qualified leads this month? Done — with the conversion rate in plain sight.
You can choose from pre-made reporting templates or roll your sleeves up and build reports from scratch. Choose from an array of displays; pie charts, bar graphs, donut charts, and more. Data can be viewed in real time, so you’re never left wondering how to pivot your sales and marketing efforts to achieve optimal results.
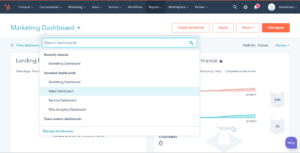
Organizing Your Reports
Of course, with endless options for creating reports, you need a way to organize them. This is where dashboards come in; Create up to 200 dashboards which can house up to 10 reports each.
Now, everyone in your company can have visibility on aggregated metrics that matter to them — whether that’s a high-level overview of marketing performance or the amount revenue a specific sales representative generated last quarter.
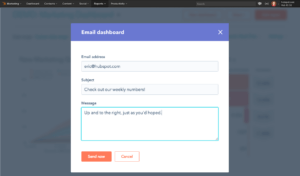
Syndicating Your Reports
Don’t let critical reports go unnoticed. The HubSpot’s Reporting Dashboard Add-On on allows you to send reports to your team’s inbox on customized timelines. Whether it’s daily, weekly, or monthly — your team will always be aware of their progress.
Why It’s Great
It’s Simple
You don’t need to be a data scientist to understand what you’re looking at. It’s all in one place — organized and in the format that is most useful and convenient for you.
Visual reports allow you to understand trends at a glance, and precise numbers provide a more detailed view of progress.
Enables Sales and Marketing Alignment
When marketing and sales work together, the possibility and fear of a lead slipping through the cracks dissolves. As a result, the ROI of marketing efforts increases, your sales team runs more efficiently, and there is visible top-line growth.
In fact, in organizations where sales and marketing are aligned, marketing acquired leads are 67% more likely to close.
How does this connect with the add-on? With the tool, you can create a report where you can see how many sales qualified leads to become opportunities. If this conversion rate seems a bit low, you have a jumping off point for correcting the problem.
Read, “The Right Way to Follow Up with Marketing and Sales Leads.”
Monitor Metrics Unique to Your Business
Because you can easily build custom reports and dashboards, you have unhindered access to metrics that matter to your business. Say goodbye to scouring your arsenal of tools to find the data points you need. They are neatly and conveniently packaged to be accessed at will.
Drawbacks
Drilling Down Into Data
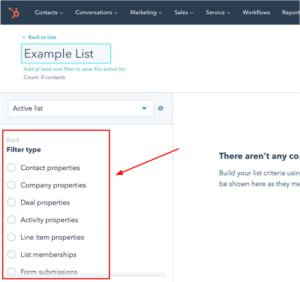
With customized reports, you can’t access granular data on broad metrics. For example, let’s say you build a report that shows how many leads fall into lifecycle stage for the current month. You can’t just click on the sales qualified lead bar to see who these leads are. For this, you will need to create a list where you will define the qualifications for a lead to appear on that list.
The Price
$200 per month is a lot — especially when tools like Google Analytics are free. To decide if it’s worth it, you need to assess why you want the tool. If you are interested in granular data such as bounce rate, entrances, the assets driving conversions, and so on, then you’ll be just fine with Google Analytics.
However, if you have grown to a point where you need to close the loop on marketing and sales efforts, then the HubSpot add-on is worth it. This brings us to the answer to the question that started this blog: Is HubSpot’s Reporting Dashboard Add-On on worth the price?
The Verdict
The tool serves as a single source of truth that encourages visibility throughout your company. Instead of just being a tool on website performance alone, like Google Analytics, it’s the be all end all tool for measuring the health of your organization.
The main drawback is the price, but if you strike up a deal with just one lead that would have slipped through the cracks otherwise, then it’s already paid for itself.
So, the answer is yes. Investing $200 per month for the add-on is worth it.